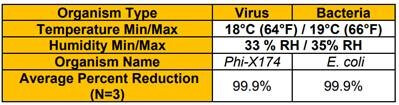
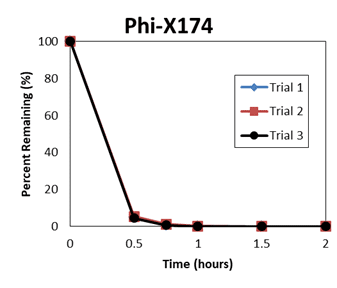
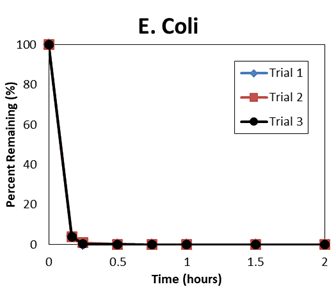
The resultant report of an independent efficacy test concludes the QwikPure TripleGuard™ unit reduced both E. coli and Phi-X174 (A small, non-enveloped virus that should be more difficult to kill than coronavirus) by 99.9% at the 2 hour point during the test. Looking at the raw data, QwikPure TripleGuard™ hit 99.9% for Phi-X174 at 60 minutes, 60 minutes, and 90 minutes in the 3 tests, and for E. coli at 30 minutes, 30 minutes, and 30 minutes.
The full report may be found here.
The test chamber measured 10’x10’x10’ (1000 cubic ft) room and a microbial suspension was aspirated into the chamber. Air samples were taken from the test chamber once the unit was turned on and sampling was taken every 5 minutes over a period of 15 minutes, then every 15 minutes until the 1 hour mark was reached, and finally every 30 minutes until the 2 hour mark was reached and then plated. The process was then repeated without the test unit in the chamber to provide the natural decay results. All plates were incubated overnight and viral growth on the test plate was compared to that of the natural decay control. Testing was completed in triplicate and results presented represent the average results of all test runs. The unit was placed inside a duct that measured 14 inch by 16 inch and 48” long and placed on a small table in the center of the room approximately 3 feet off the ground. Air sampling took place using an SKC BioStage Single-stage impactor for 30 seconds at 12L/min (.424 cubic feet/min). Results below represent the percent reduction at 120 minutes.
Below are plots of the raw data.
NOTE: TNTC = too numerous to count. <1 uses 1 as the raw value for % removed.
| Coliphage phi X174 | ||||||
| Challenge Concentration (CFU/mL) | 5.00E+09 | |||||
| Time | Trial 1 Result (CFU) | Trial 2 Result (CFU) | Trial 3 Result (CFU) | Trial 1 Result (% Removed) | Trial 2 Result (% Removed) | Trial 3 Result (% Removed) |
| 0 | TNTC | TNTC | TNTC | TNTC | TNTC | TNTC |
| 5 | TNTC | TNTC | TNTC | TNTC | TNTC | TNTC |
| 10 | TNTC | TNTC | TNTC | TNTC | TNTC | TNTC |
| 15 | TNTC | TNTC | TNTC | TNTC | TNTC | TNTC |
| 30 | 133 | 140 | 119 | 94.94 | 94.67 | 95.47 |
| 45 | 15 | 30 | 17 | 99.43 | 98.86 | 99.35 |
| 60 | 2 | 5 | <1 | 99.92 | 99.81 | 99.96 |
| 90 | <1 | <1 | <1 | 99.96 | 99.96 | 99.96 |
| 120 | <1 | <1 | <1 | 99.96 | 99.96 | 99.96 |
| E. Coli | ||||||
| Challenge Concentration (CFU/mL) | 8.80E+08 | |||||
| Time | Trial 1 Result (CFU) | Trial 2 Result (CFU) | Trial 3 Result (CFU) | Trial 1 Result (% Removed) | Trial 2 Result (% Removed) | Trial 3 Result (% Removed) |
| 0 | TNTC | TNTC | TNTC | TNTC | TNTC | TNTC |
| 5 | TNTC | TNTC | TNTC | TNTC | TNTC | TNTC |
| 10 | 112 | 103 | 106 | 95.74 | 96.08 | 95.97 |
| 15 | 5 | 26 | 9 | 99.81 | 99.01 | 99.66 |
| 30 | 1 | 3 | 4 | 99.96 | 99.89 | 99.85 |
| 45 | <1 | <1 | <1 | 99.96 | 99.96 | 99.96 |
| 60 | <1 | <1 | <1 | 99.96 | 99.96 | 99.96 |
| 90 | <1 | <1 | <1 | 99.96 | 99.96 | 99.96 |
| 120 | <1 | <1 | <1 | 99.96 | 99.96 | 99.96 |